Yes, you can connect to the historian, you just have to follow some steps:
1 - Create a table in Tags > Historian and attach some tags to it.
2 - Go in Datasets > “DB Admin…” and see if you can find the table you have just created
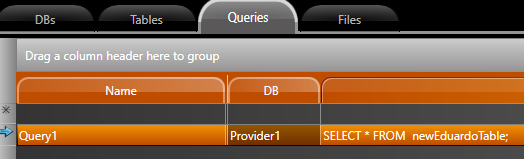
3 - Go in Datasets > Tables, fill the field Name, DB and TableName
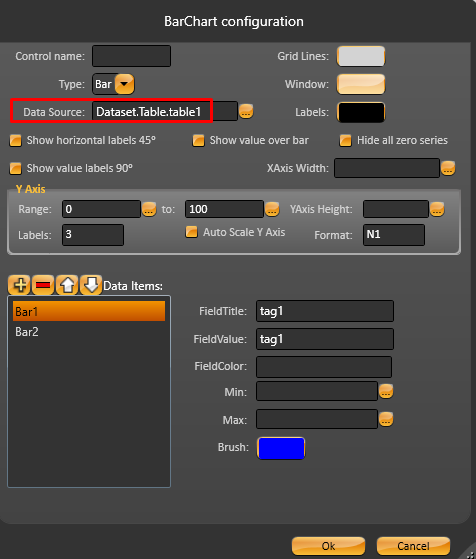
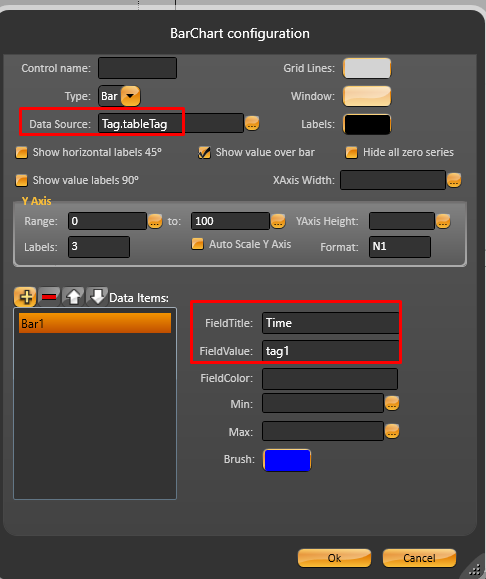
Then you go in BarChart configuration and change the Data Source to the table you’ve created.
Dear Sir/Madam.
Thanks for your extremely useful information.
So, Can I put these symbols into report Page
If you have the sample project, it’s very great.
Best.
Yes, you can put these symbol into a Report page.
There is a better way to do that than I just said and it is putting the table into a Tag DataTable datatype, in Codebehind you will write a line doing a SelectCommand in the table
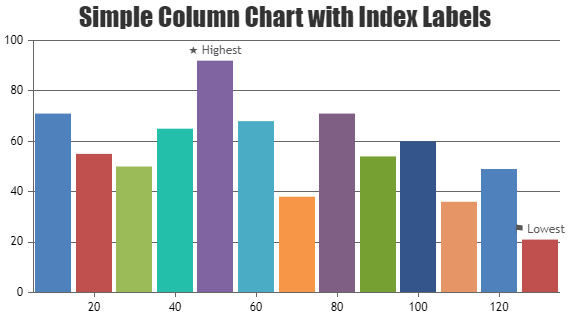
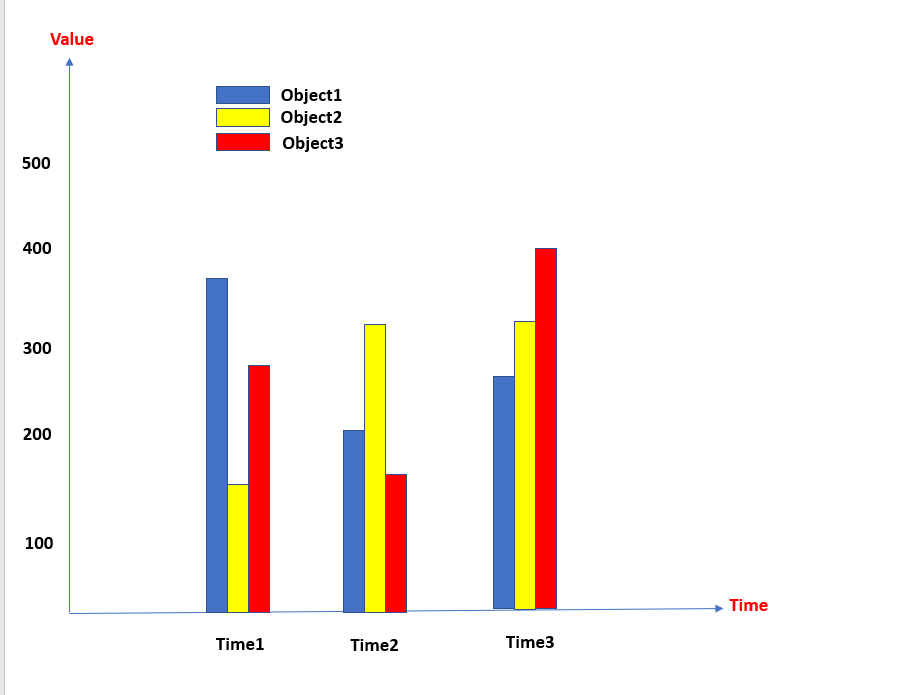
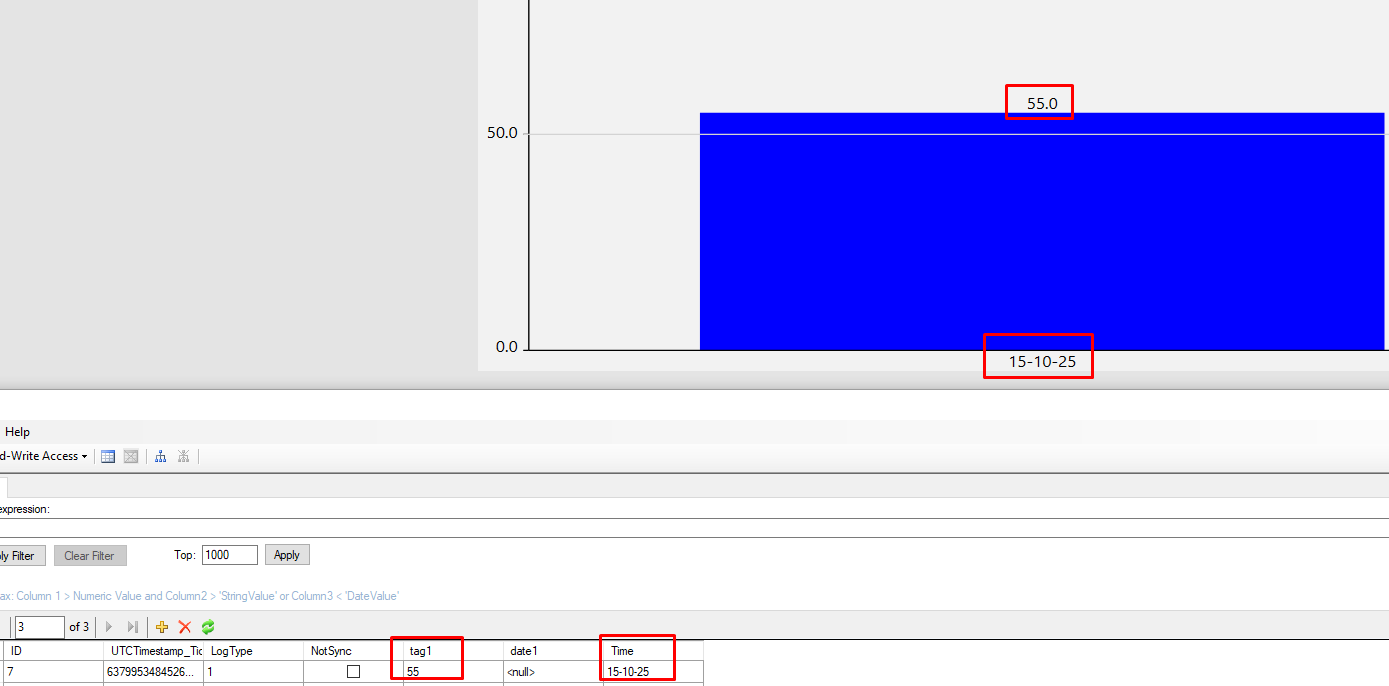
I need to use Barchar to display data of the table at SQL server ( Table as below picture). The Date column will fill to X Axis of Barchar, the remain column were object need to be drawn on Barchar.
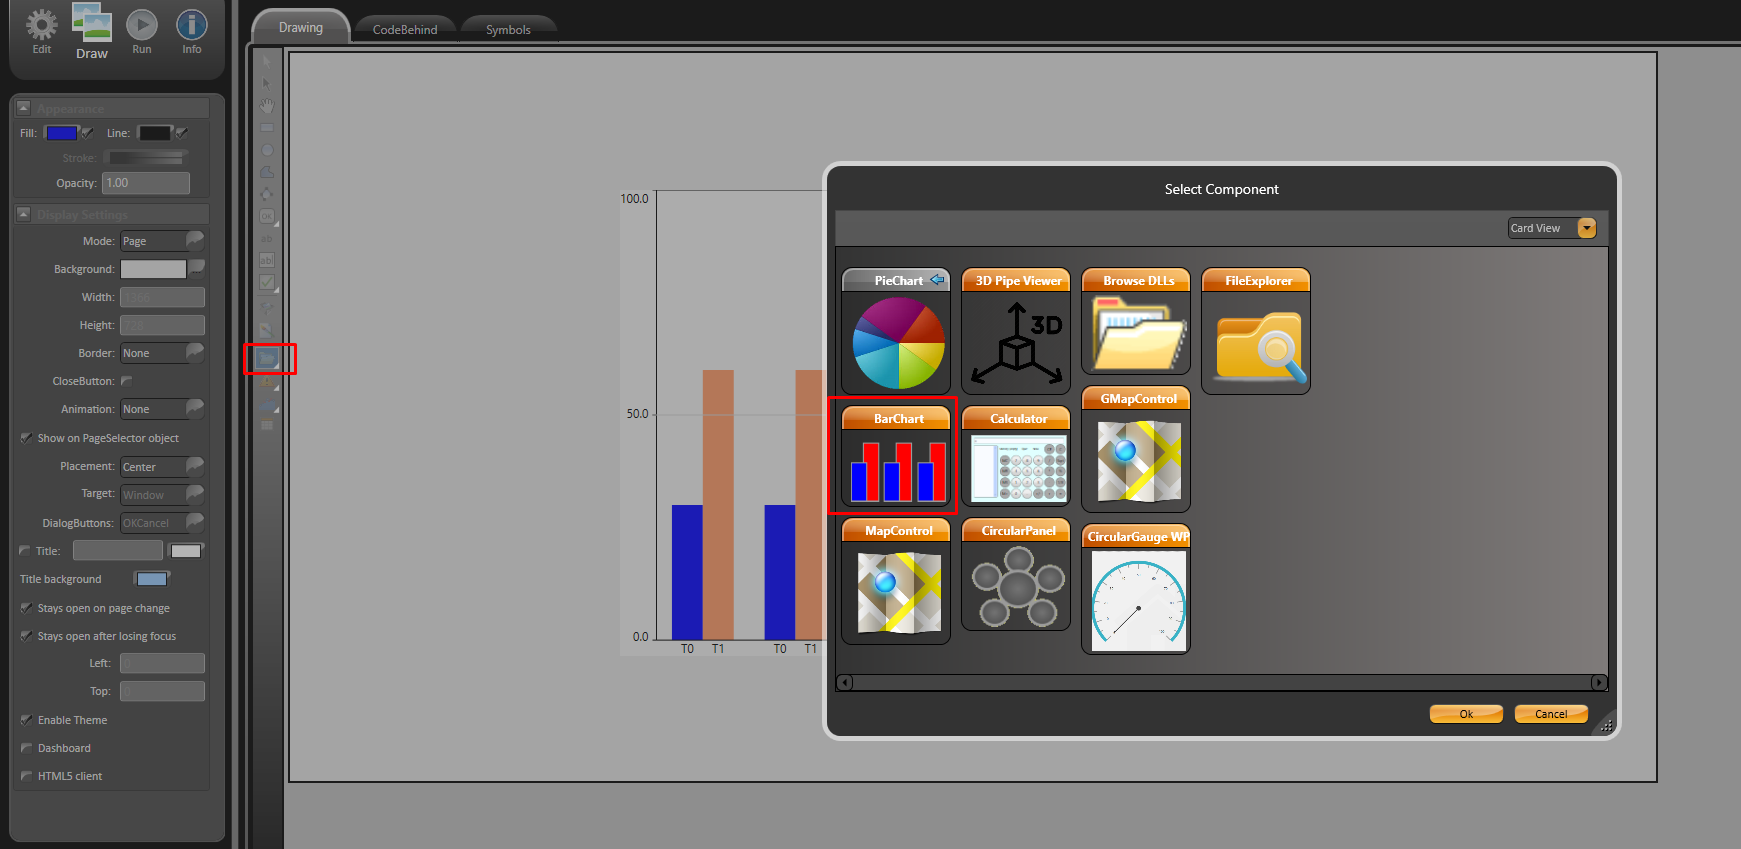
Strange, I just opened it here, but anyway, we will show you how to insert the barChart and you tell us if it don`t work, ok?
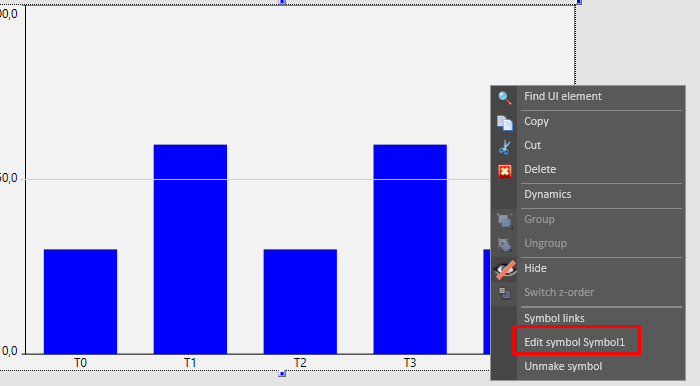
You will not edit this properties in the report editor, you will do this through the Draw environment.
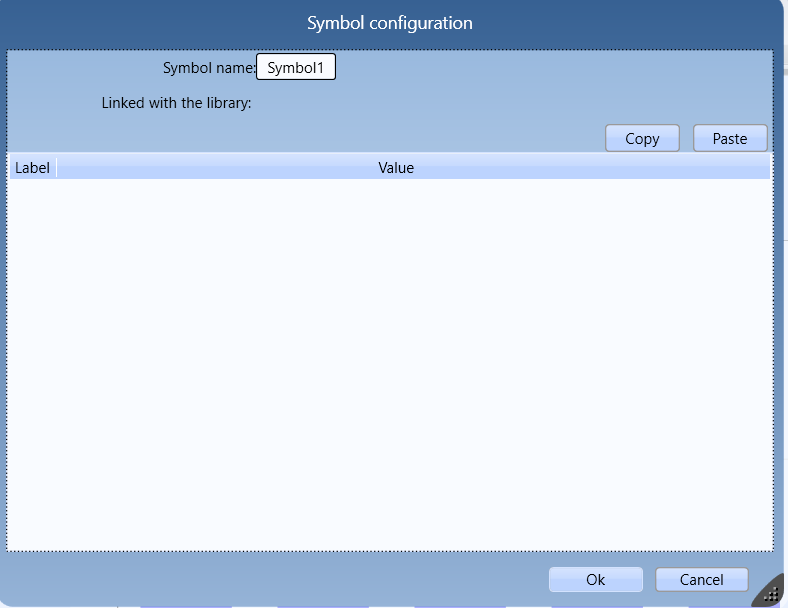
You can right click on the symbol and “Edit symbol Symbol1”
If you want to use the values from the database you have some options depending on what you need, you can use either the Historian or do a query from the database. If you need more information about it, please send us and e-mail in: support@tatsoft.com
I knew the way to insert and config Barchar in Draw environment.
But If I don’t edit properties of barchar in Report editor. How can I link barchar at report editor to one Barchar at one Draw. Because in the project, I can create many Barchar at many Draw
I knew the way to use Database as Data source of BarChar. I mean here that the How can I configure X Axis as Datetime column of Data
Best.
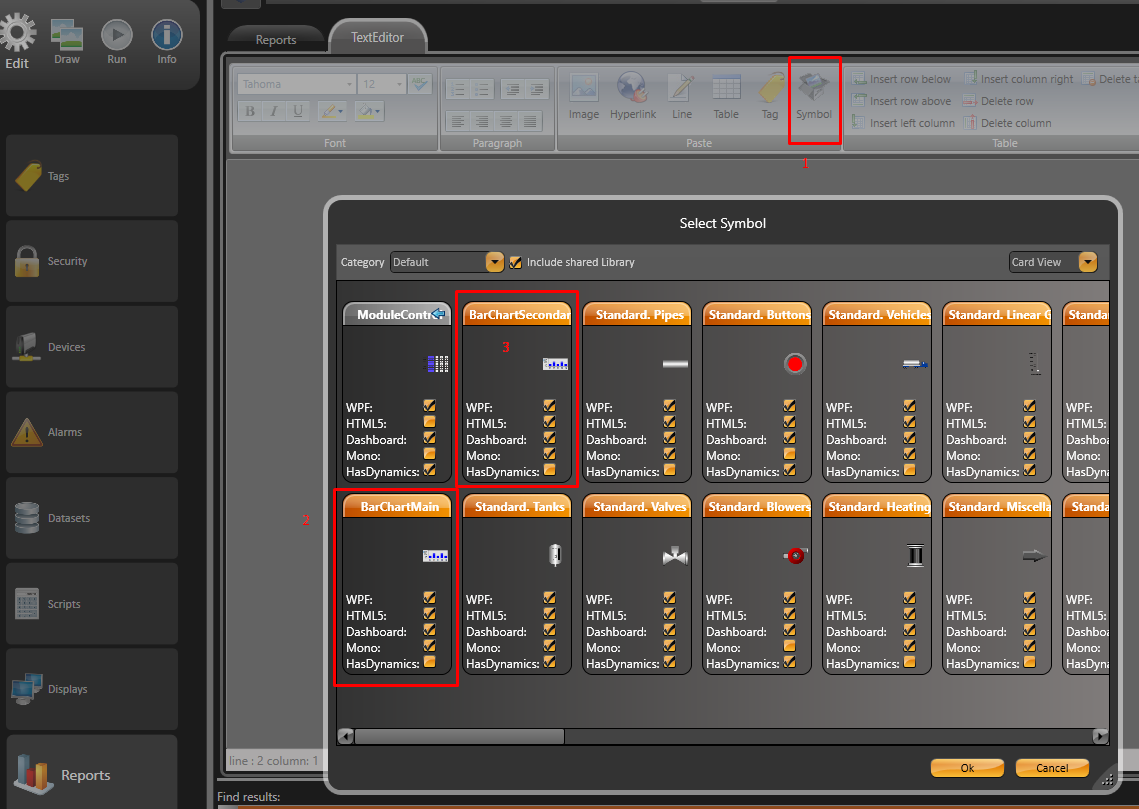
2- Yes, you can create many Barchart, but each one will be a different symbol. Let’s say that we have 2 BarChart in Draw, we right click in the first one and make it a symbol named “BarChartMain”, then we do the same to the second BarChart and name it as “BarChartSecondary”. Then you go in Report Editor and you will see that you have different symbols to select:
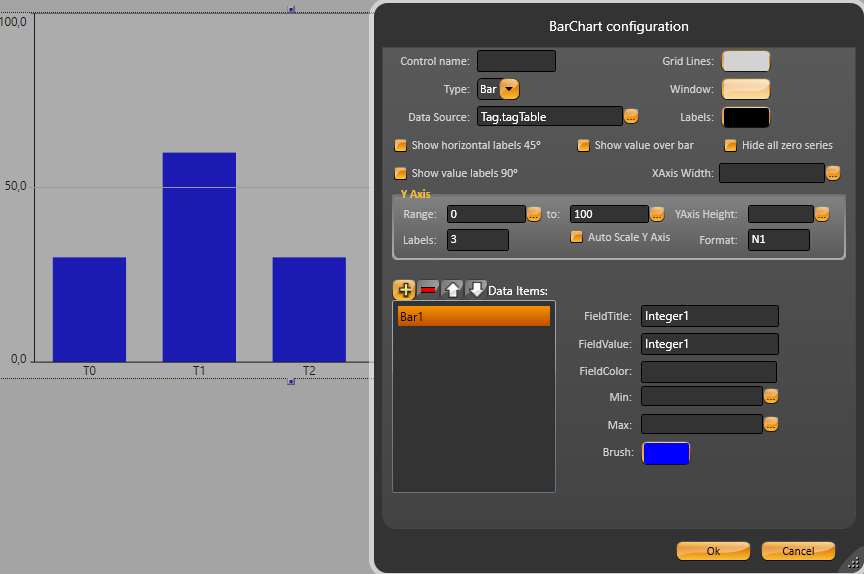
3- You just have to configure the BarChart configuration as the image below, in the “FieldTitle” field you will put the name of the column you want to show in X axis, in your case it would be “Date”. In “FieldValue” it will be the data.
Hi Eduardo
That amazing information.
Can I have one more question please.
Assumed that The DataSource of Barchart is a table at SQL Server.
I found that when data in table change, The Barchart in draw dinn’t update corresponding.
How can I do this ( in 2 cases Barchart is used as nature symbol and new symbol for report)?
Best.
1 - We did the test using SQL Lite and it worked fine, we can prepare a test environment in our labs to try to reproduce this with SQL Server.
2 - We would like to understand it better, so could you send us the project and also print screen of the parts you are having issue?
OBS: It is the same Barchart you will use in Draw and Report, both will be a Symbol.
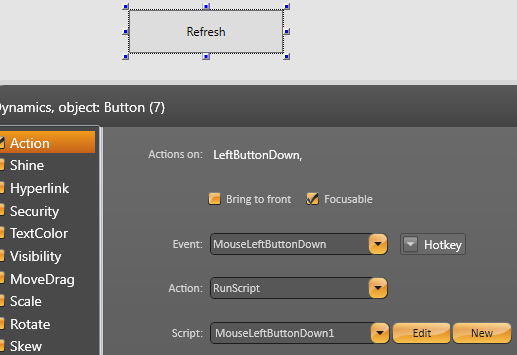
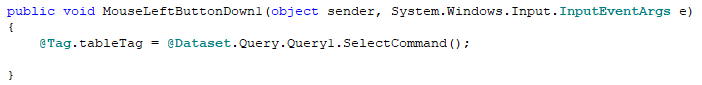
We were wondering we know the issue you were having with updating data on SQL Server. For updating you can go to another display and then go back. Or also for better performance you can create a button, and then you call a query to load the datatable from SQL Server, as you can see in the images below:
Button configuration: